Dashboard
Better Decisions. Better Visuals. All in Excel.
Microsoft Excel Consulting
Background
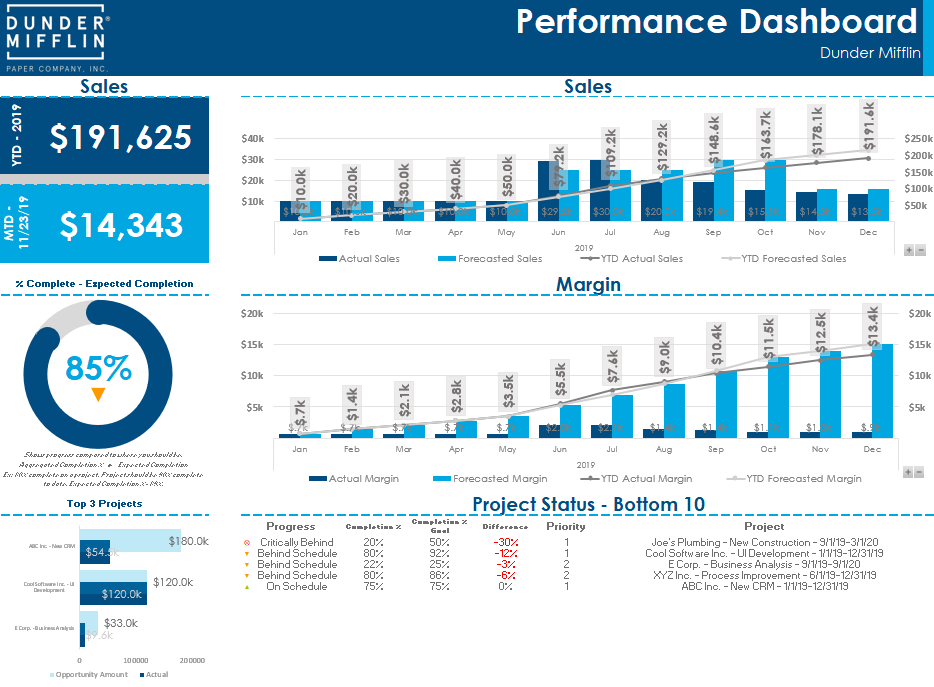
The client is a consulting firm that needed an easy way to view sales and margin performance over time.
They needed to be able to filter down by consultant and project.
Why You Want One
Better Decisions
Making better decisions is what sets competitors apart. Better decisions help you grow your business faster.
Easier
Who has time to build a report each week? We don’t. Manage and view sales team performance with a simple click of a button.
Cost Effective
No licenses. No monthly cost. A Microsoft Excel dashboard allows you to distribute to as many or as few users as you want.
Modern
Design is important. Spreadsheets don’t need to be (and shouldn’t be) boring. They should tell a story.
Scalable
It works whether you have 5 rows, 5k rows, or 500k rows. The tool grows with you.
Powerful
See results over time. View performance over years, quarters, months, and days. Filter down by consultant/rep and by project.
Flexible
You won’t need to call us next year so the tool works for the next year. It’s robust and flexible to handle a variety of input.
Client Pain Points
Time-Consuming
The client felt their current tool was cumbersome and time-consuming to update.
Inaccurate
Their current tool did not calculate consistently and accurately. There were several formulas errors.
Several Tabs
The user was required to go into several tabs in order to populate the tool each month.
Not Visually-Appealing
It was difficult to understand the data. There were not charts present to visualize performance. It looked more 1999 than 2019.